Low-field NMR

Nuclear Magnetic Resonance (NMR) uses the interaction of the magnetic moment of atomic nuclei in a static magnetic field and a superimposed electromagnetic alternating field.

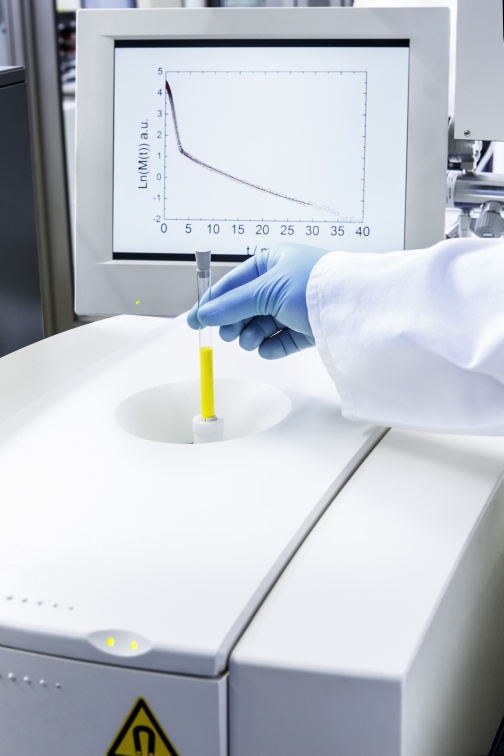
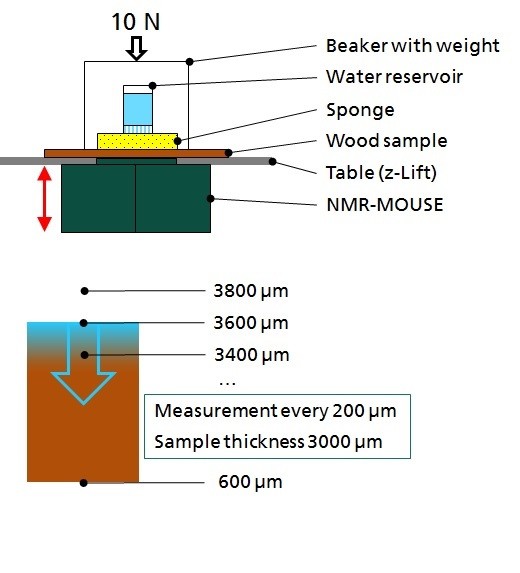
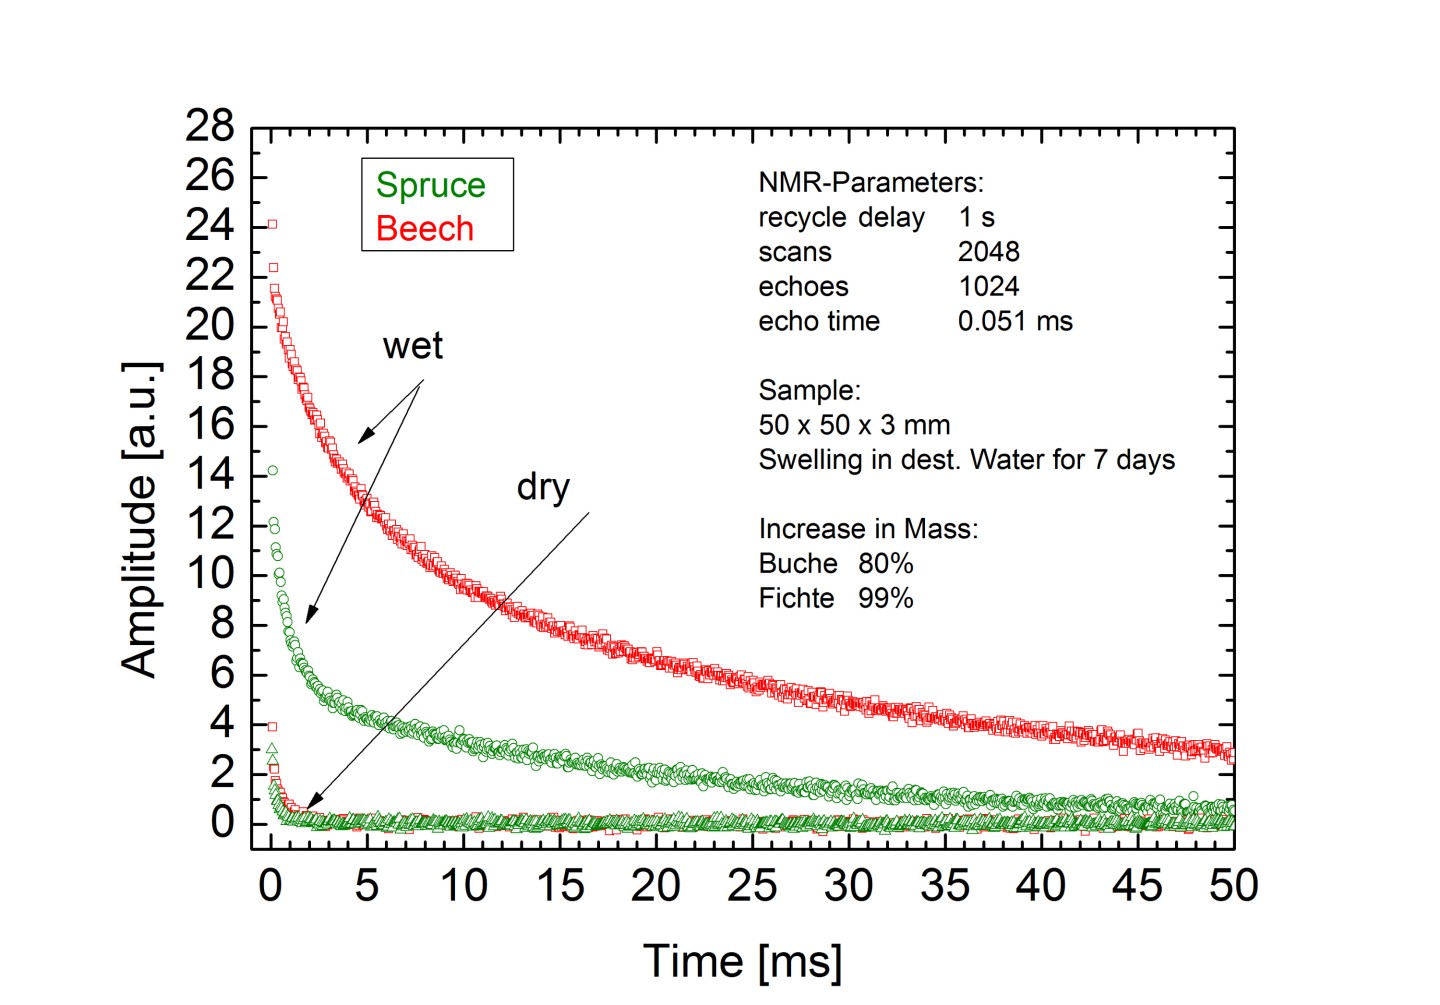
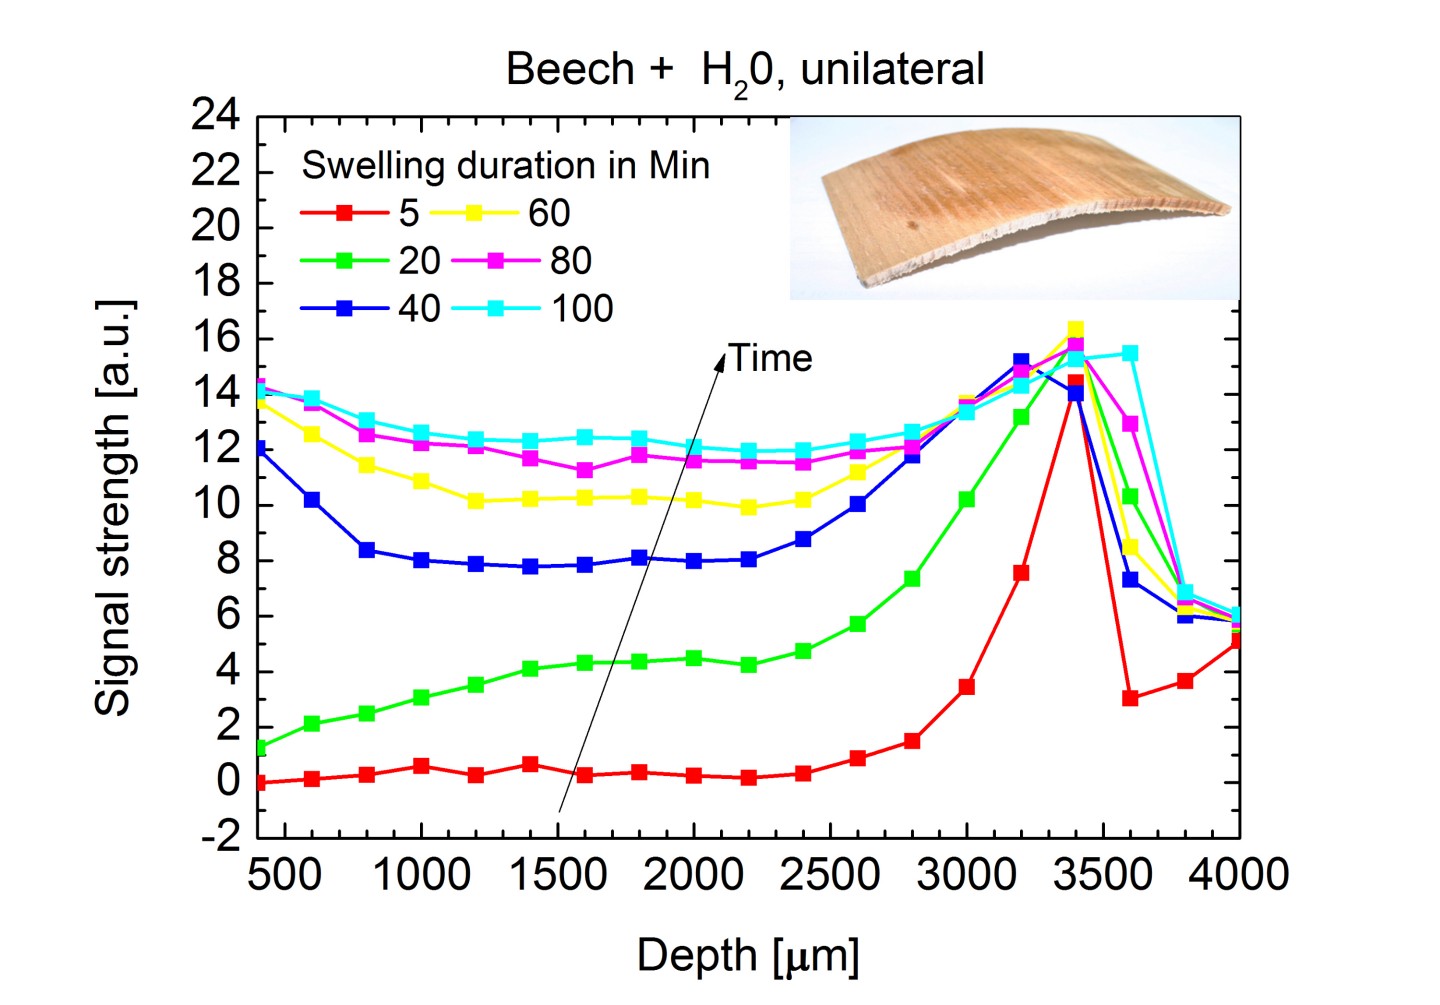
Low field NMR instruments for relaxation examinations (solid state NMR) use static magnetic fields in the order of one Tesla or less and operate at frequencies between 10 MHz and 50 MHz. Due to their relatively small size and easy operation, they have great potential in quality control and industrial applications. Impulse sequences such as Hahn-Echos and CPMG sequences are used. Longitudinal relaxation time (spin-lattice relaxation time) T1, transversal relaxation time (spin-spin relaxation) T2  and signal amplitudes A1 and A2 are interpreted and analyzed.

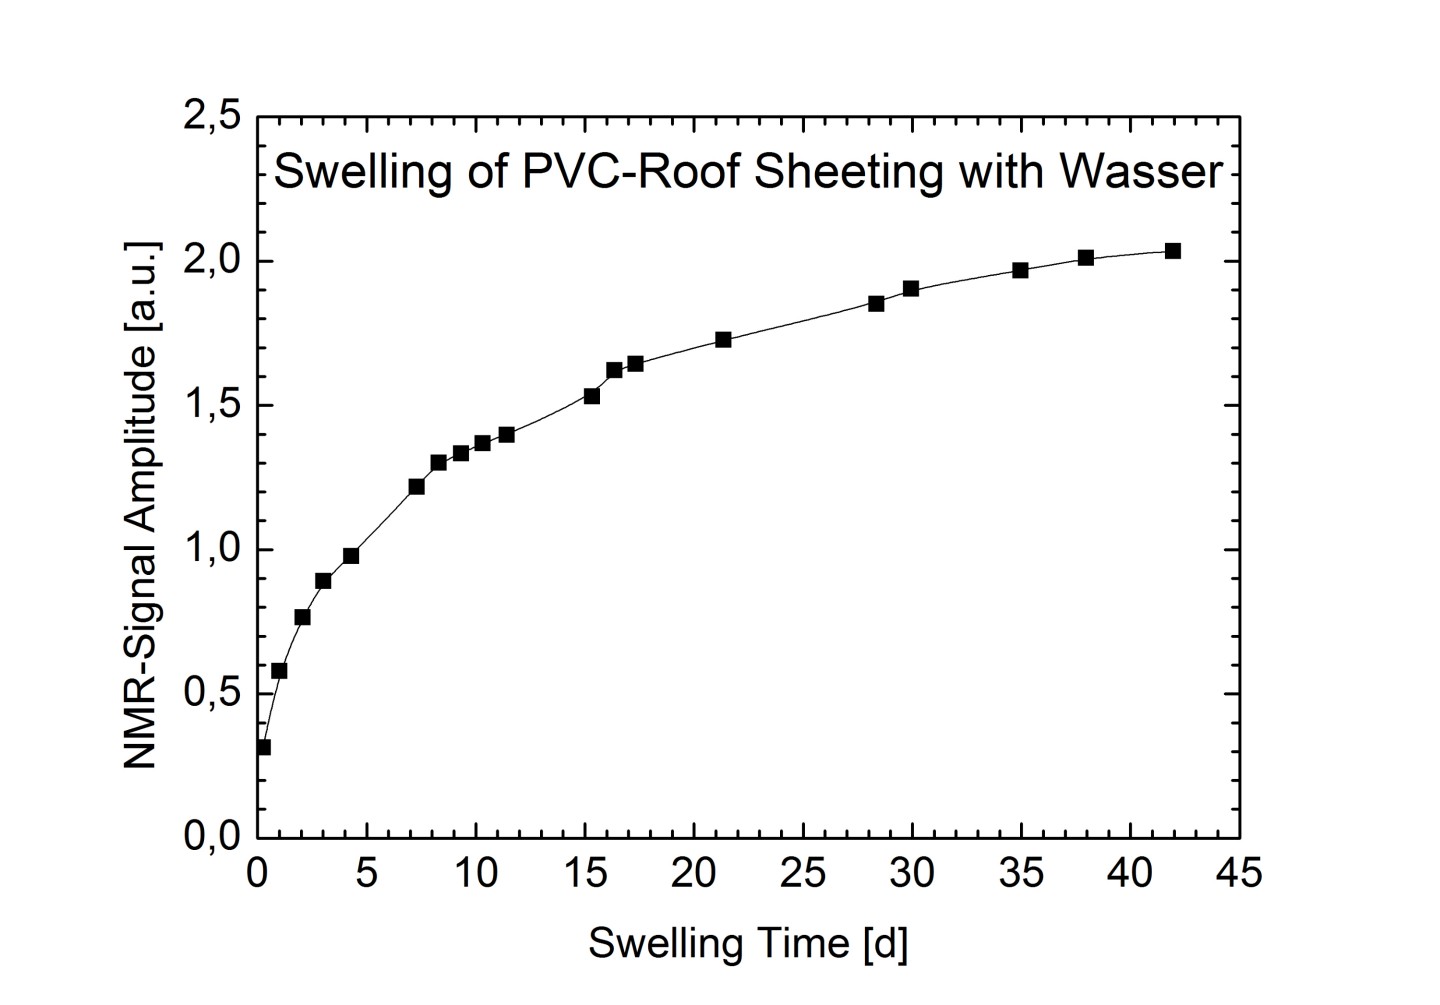
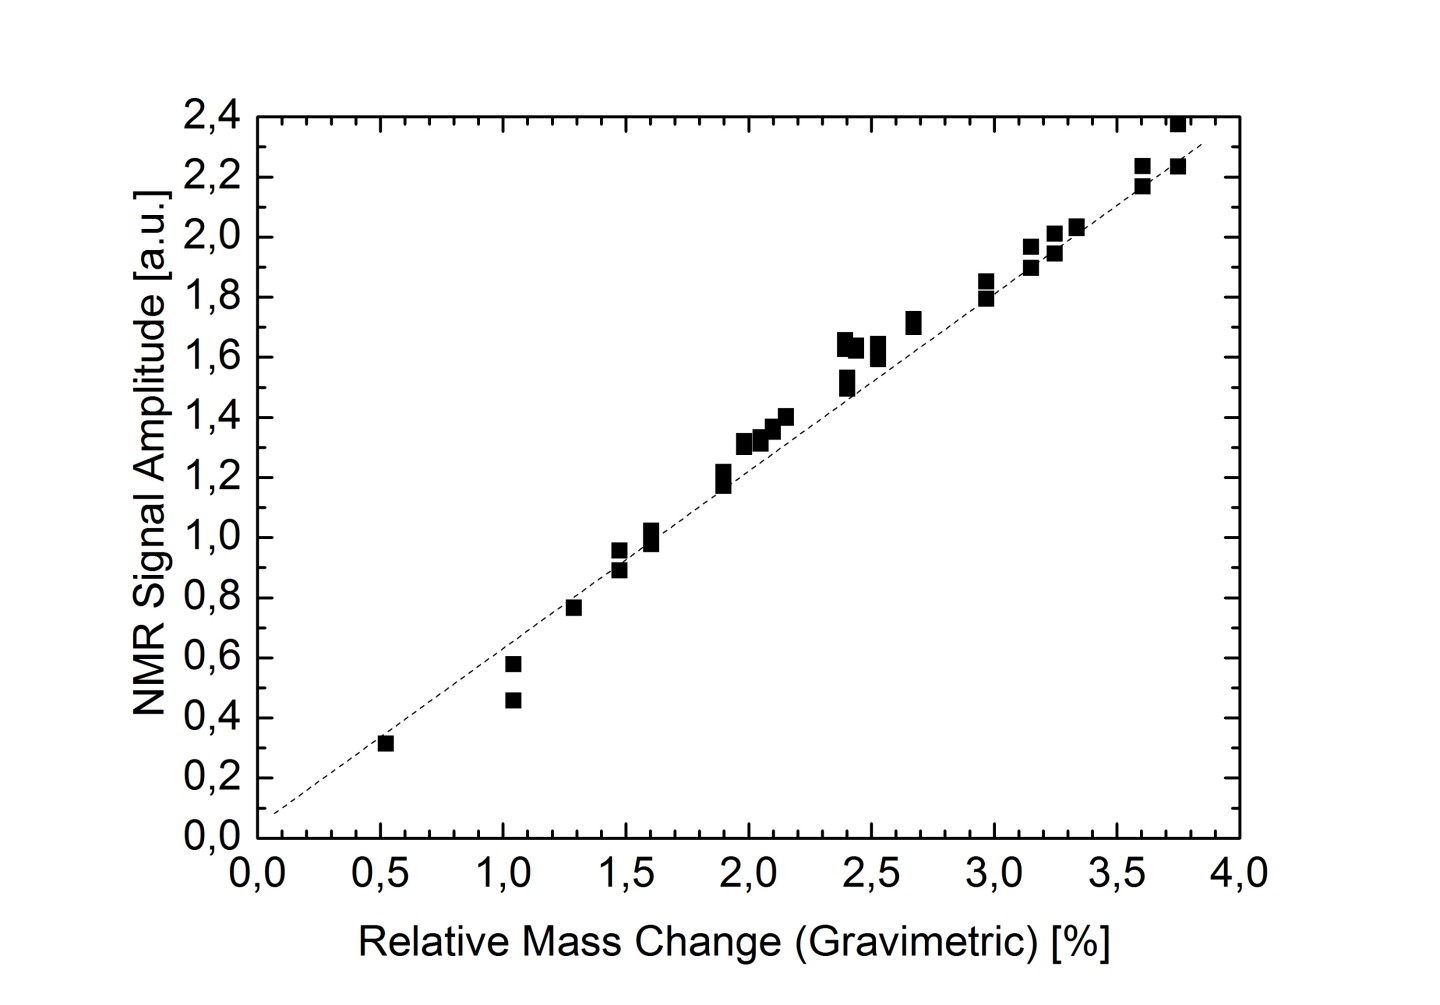
Areas of application are, for example, the examination of elastomers and rubber (e.g. cross linking density), the determination of phase compositions of polymer mixtures or the degree of crystallization of thermoplastics. Especially the content of proton rich phases such as oil, fat and water or plasticizer content in polymers can be determined. Even time and temperature dependent processes such as aging, crystallization and relaxation properties can be examined with low field NMR instruments.

Besides the described low field NMR instruments for temperature dependent relaxation examinations and the analysis of unilateral, spatially-resolved, planar test specimens (profiling), Fraunhofer LBF also has various high resolution NMR spectrometers for chemical analysis at its disposal.

The setup for temperature dependent measurements consists of a spectrometer “minispec mq20” (Bruker) and a separate temperature controller “BVT3000” (Bruker).

Sample geometry:           sample tubes (D=8 mm)
Temperature range:        -100 °C to 80 °C
Measurement frequency: 20 MHz

Areas of application are, for example, the determination of cross-linking density of elastomers, the temperature dependent examination of the degree of crystallization of a polymer, or the determination of plasticizer content in roofing membrane or geotextiles.

For unilateral, spatially resolved measurements (profiling), Fraunhofer LBF has a measurement setup, consisting of a low field spectrometer “minispec” (Bruker) and a vertically adjustable magnet “NMR-MOUSE” (manufacturer: ACT) available. With this setup it is possible to profile samples in depth. Unilateral measurements use a one sided freely accessible magnetic field. The examination is non-destructive and additional sample preparation is not required. The spatially resolved measurements can either be conducted at indoor climate or in a controlled climate.

Sample geometry:             any desired geometry and size
Temperature range:          10°C to 50°C
Frequency:                        13MHz

Areas of application are the examination of time or spatially dependent transport, drying and hardening processes under controlled climatic conditions. Furthermore, the determination of local water content in thin layers and the monitoring of aging of roofing membranes or geotextiles are possible with this method.

Determination of Plasticizer Content in PVC Roofing Membranes

Many polymers are exposed to strong mechanical or thermal stresses in their environment, as well as the influence of surrounding media such as water or solvents. This can cause drying, swelling, the extraction or diffusion of additives or plasticizers out of the polymer and lead to chemical or physical aging processes. Many of these issues can be examined with low field NMR. This example of PVC roofing membranes shows how plasticizer and water content can be determined with low field NMR.

The upper figure shows the NMR signal amplitude over the transversal relaxation time (free induction decay, FID) for three different PVC foils with a plasticizer content of 25%, 35% and 40%, respectively. With increasing plasticizer content, the mobility of the polymer chains and therefore their relaxation time decreases. The FID curves drop slower accordingly. If the relation between relaxation time and plasticizer content is known, the plasticizer content can be determined with the help of a calibration curve measured by NMR.

For example, when a PVC roofing membrane is wetted, it usually absorbs some water through diffusive transportation processes. Because water is a proton rich phase, it creates a strong measuring signal in low field NMR, from which the water absorption can be monitored. This measurement is both time and depth dependent. The second figure shows the chronological sequence of the NMR signal amplitudes, approximately 100 µm under the surface of the PVC roofing membrane, during swelling. The sequences of the NMR-signal amplitudes correlate well with the results of a weighing experiment, to determine the water uptake. The examined PVC roofing membrane showed a linear correlation between the water uptake and the NMR-signal amplitude (lower figure).  This way, with a proper calibration measurement, the water content of a polymer foil can be determined via low field NMR measurements. The same applies to proton rich organic solvents.

Determination of Water Content in Polymers and Wood

Through the interpretation of signal amplitude and determination of the T2 relaxation times, the depth dependent humidity distribution in swelling or drying polymers and other materials (in this case wood) can be monitored with unilateral low field NMR. For this, the NMR measuring head (NMR-MOUSE) is moved vertically, to acquire signals from different depths of the sample. This allows, for example, the monitoring of one-sided swelling of a beech and a spruce board with water.

The wooden boards are placed above the NMR measuring head and “fed” with water from a sponge (see schematic figure).

The NMR signals (CPMG pulse sequence), in the figure in the middle, show a significant difference in amplitude and relaxation time between dry and wet wood. Furthermore, they allow the distinction between different types of wood.

The swelling of the wood can be monitored time and depth dependent with the spatially resolved measurement setup. In the lower figure the signal strength is pictured as a function of sample depth after different swelling durations. The quick increase of water content near the surface (close to the sponge), as well as the time delayed absorption of water in deeper layers can be detected.